Breast-Cancer-Detection

Breast Cancer Prediction
Table of Contents
- About
- Logistic Regression
- Why have I used logistic regression in this project?
- Why I found Logistic Regression to be preferrable in this project?
- Dataset
- Working of the Model
- Libraries Used
About the Project
In this repository, I have developed a Breast cancer Prediction System using Logistic Regression. I am using Logistic Regression to classify and predict breast cancer.
Logistic Regression
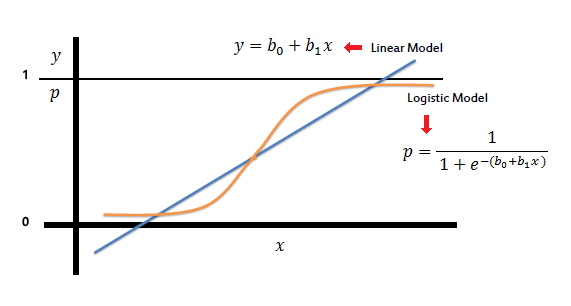
Logistic regression estimates the probability of an event occurring, such as voted or didn’t vote, based on a given dataset of independent variables. Since the outcome is a probability, the dependent variable is bounded between 0 and 1.


Why have I used logistic regression in this project?
Logistic Regression is used when the dependent variable(target) is categorical, such as to predict whether the tumor is malignant (1) or benign (0).
Why I found Logistic Regression to be preferrable in this project?
Logistic regression analysis is valuable for predicting the likelihood of an event. It helps determine the probabilities between any two classes by analyzing or training on historical data.
Dataset
I am importing the classified breast cancer wisconsin dataset. The breast cancer dataset is a classic and very easy binary classification dataset.
=================   ==============
Classes                          2
Samples per class*   212(M),357(B)
Samples total                  569
Dimensionality                  30
Features            real, positive
=================   ==============
The copy of UCI ML Breast Cancer Wisconsin (Diagnostic) dataset is downloaded from here.
Data Set Information
Features are computed from a digitized image of a Fine Needle Aspirate (FNA) of a breast mass. They describe characteristics of the cell nuclei present in the image.
Attribute Information:
1) ID number 2) Diagnosis (M = malignant, B = benign) 3) Ten real-valued features are computed for each cell nucleus: - radius (mean of distances from center to points on the perimeter) - texture (standard deviation of gray-scale values) - perimeter - area - smoothness (local variation in radius lengths) - compactness (perimeter^2 / area - 1.0) - concavity (severity of concave portions of the contour) - concave points (number of concave portions of the contour) - symmetry - fractal dimension (coastline approximation - 1)
Working of the Model
The dataset is loaded and then the data and targets are separated out. The data consists of 569 instances and 30 features.
The data is then split into training and testing data by using *train_test_split* funtion of Scikit Learn. There were now 426 training data and 143 testing data, but so many testing data were not required so the *test_size* was assigned as 0.1 that means the 10% of the whole data. Now there are 512 training and 57 testing data.
Then from the mean it was observed that the distribution of the data was not even. So the data was stratified. Now the data was equally distributed among the two targets Malignant[0] and Benign[1].
| Benign [1] | Malignant [0] |
|---|---|
| Benign refers to a condition, tumor, or growth that is not cancerous. This means that it does not spread to other parts of the body. It does not invade nearby tissue. Sometimes, a condition is called benign to suggest it is not dangerous or serious. In general, a benign tumor grows slowly and is not harmful. | Malignancy is the tendency of a medical condition to become progressively worse. Malignancy is most familiar as a characterization of cancer. |

For more information about Benign and Malignant Tumor, you can refer from VeryWellHealth page related to this.
Further the LogisticRegression model is loaded and the training data is fitted in the variable where the model is loaded. Then the model is evaluated and the prediction on the training data is made. For testing the accuracy of it we need another function that is the accuracy_score function. The accuracy of our prediction on training data was observed as 95.12% while the accuracy of our prediction on testing data was observed as 92.98%.
Libraries Used
![]() Scikit Learn is a Python module integrating classical machine
learning algorithms in the tightly-knit world of scientific Python
packages (numpy, scipy, matplotlib).
It aims to provide simple and efficient solutions to learning problems
that are accessible to everybody and reusable in various contexts:
machine-learning as a versatile tool for science and engineering.
Scikit Learn is a Python module integrating classical machine
learning algorithms in the tightly-knit world of scientific Python
packages (numpy, scipy, matplotlib).
It aims to provide simple and efficient solutions to learning problems
that are accessible to everybody and reusable in various contexts:
machine-learning as a versatile tool for science and engineering.
![]() Pandas is a Python package providing fast, flexible, and expressive data
structures designed to make working with "relational" or "labeled" data both
easy and intuitive. It aims to be the fundamental high-level building block for
doing practical, **real world** data analysis in Python. Additionally, it has
the broader goal of becoming **the most powerful and flexible open source data
analysis / manipulation tool available in any language**. It is already well on
its way toward this goal.
Pandas is a Python package providing fast, flexible, and expressive data
structures designed to make working with "relational" or "labeled" data both
easy and intuitive. It aims to be the fundamental high-level building block for
doing practical, **real world** data analysis in Python. Additionally, it has
the broader goal of becoming **the most powerful and flexible open source data
analysis / manipulation tool available in any language**. It is already well on
its way toward this goal.
![]() NumPy provides
- An array object of arbitrary homogeneous items
- Fast mathematical operations over arrays
- Linear Algebra, Fourier Transforms, Random Number Generation
NumPy provides
- An array object of arbitrary homogeneous items
- Fast mathematical operations over arrays
- Linear Algebra, Fourier Transforms, Random Number Generation